Table of Contents generated with DocToc
Results
Hotspots Enriched With Name Quality and Complexity Measures
| Has good name? | Revisions | LOC | Complexity | Module | |||
|---|---|---|---|---|---|---|---|
| Total | Mean | SDev | Max | ||||
| yes | 46 | 165 | 288.5 | 1.75 | 1.15 | 3.0 | frontend/src/patients/view/ViewPatient.tsx |
| no | 39 | 141 | 182.5 | 1.29 | 0.8 | 3.0 | frontend/src/__tests__/HospitalRun.test.tsx |
| yes | 36 | 228 | 154.0 | 0.67 | 0.47 | 2.0 | frontend/src/patients/patient-slice.ts |
| no | 34 | 65 | 122.0 | 1.88 | 1.74 | 4.5 | frontend/src/HospitalRun.tsx |
| yes | 34 | 273 | 261.0 | 0.96 | 0.55 | 4.0 | frontend/src/__tests__/patients/view/ViewPatient.test.tsx |
| yes | 30 | 104 | 198.5 | 1.91 | 1.58 | 5.0 | frontend/src/patients/related-persons/RelatedPersonTab.tsx |
| yes | 28 | 367 | 553.5 | 1.51 | 0.54 | 2.5 | frontend/src/__tests__/patients/patient-slice.test.ts |
| yes | 27 | 129 | 126.0 | 0.97 | 0.66 | 2.5 | frontend/src/user/user-slice.ts |
| yes | 27 | 141 | 130.0 | 0.92 | 0.6 | 3.5 | frontend/src/__tests__/patients/new/NewPatient.test.tsx |
| yes | 27 | 103 | 100.0 | 0.97 | 0.75 | 3.0 | frontend/src/patients/new/NewPatient.tsx |
Trends for Selected Hotspots
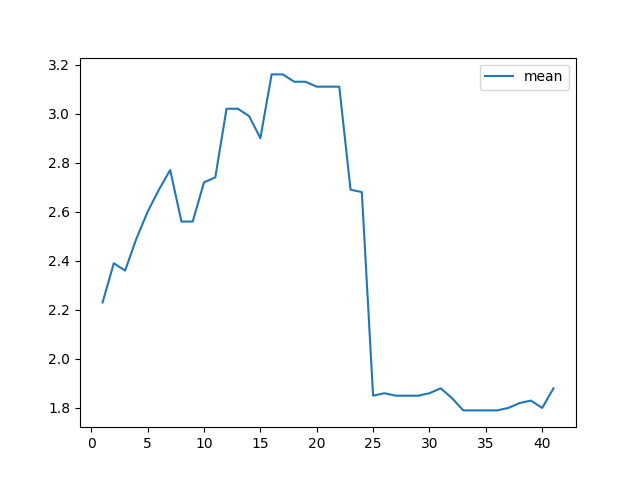
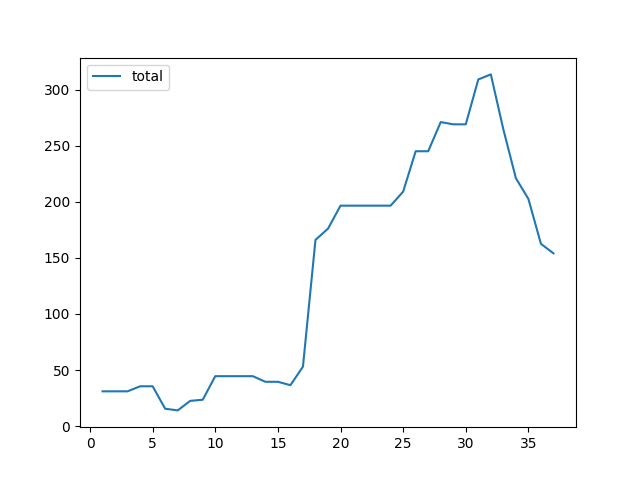
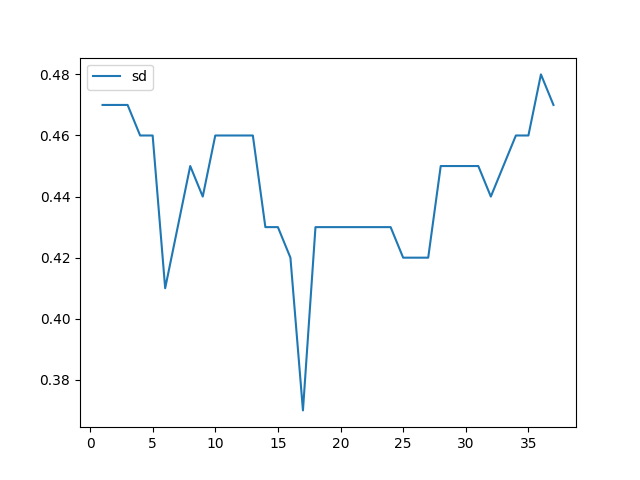
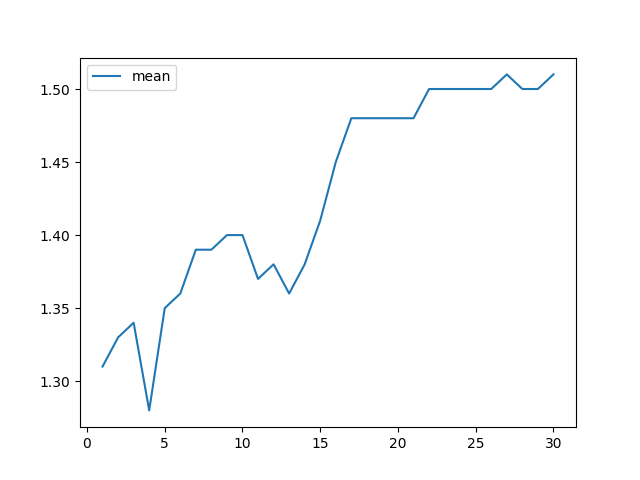
ViewPatient.tsx
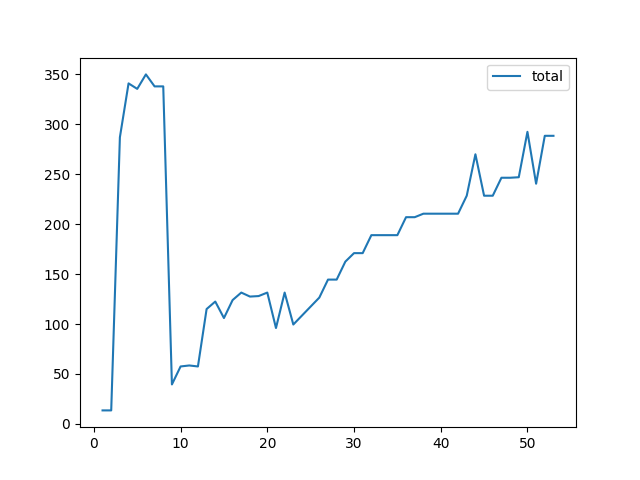
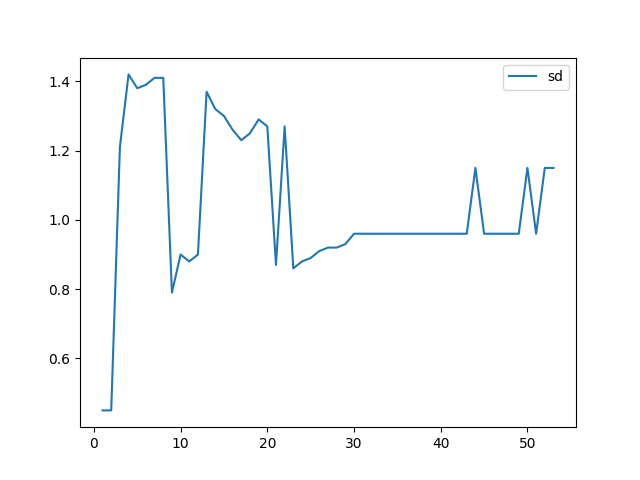
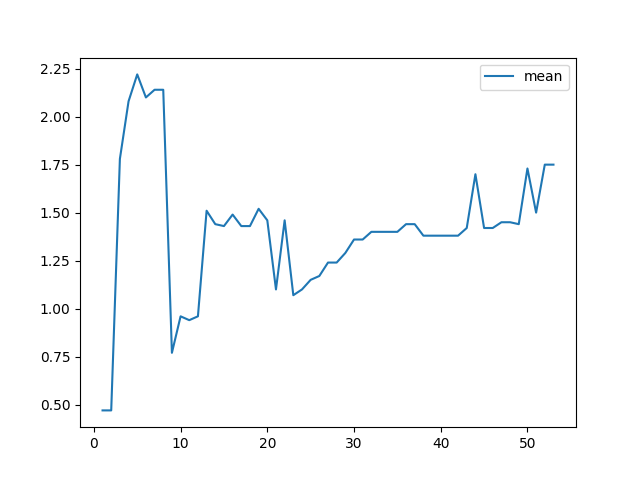
The overall complexity of ViewPatient has been growing steadily over the past year. The nearly constant values of mean complexity and standard deviation indicate that the growth is caused by an increase of file length.
ViewPatient.test.tsx
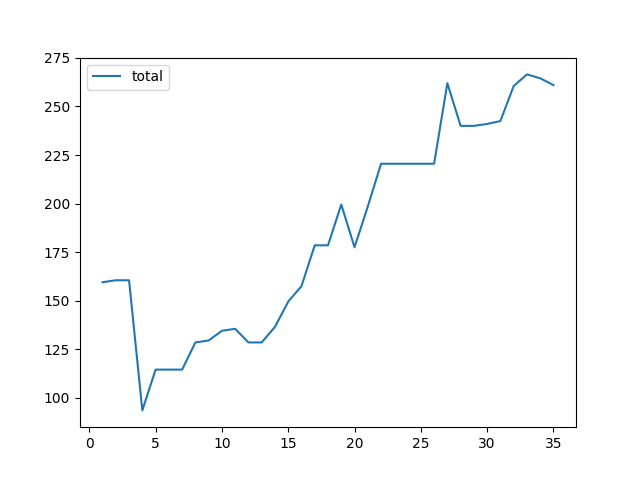
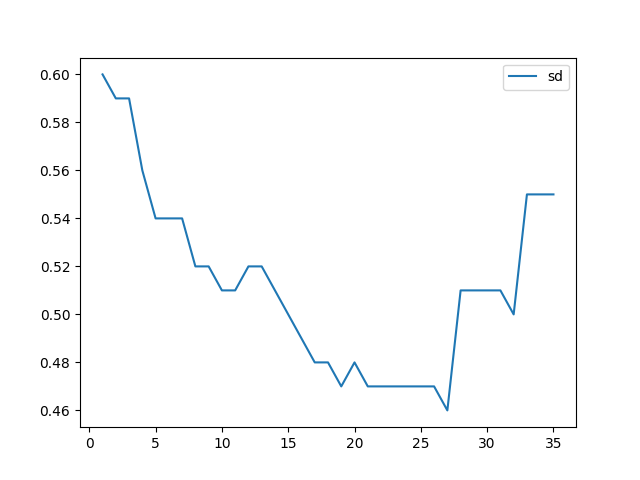
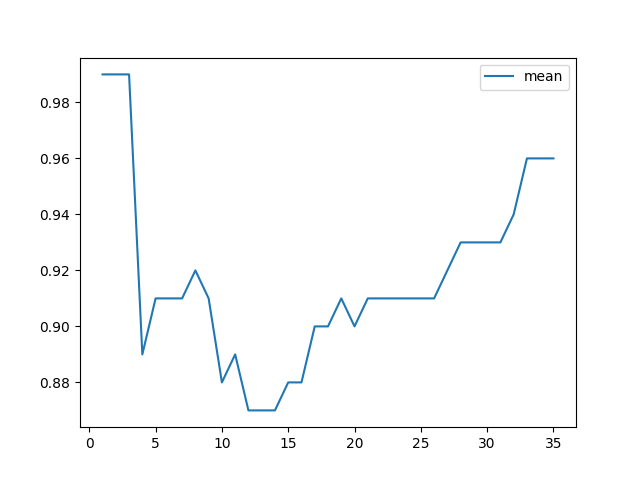
The tests for ViewPatient show the same evolution as the class itself. Mean and standard deviation of complexity show an increase towards the end of the observed time period.
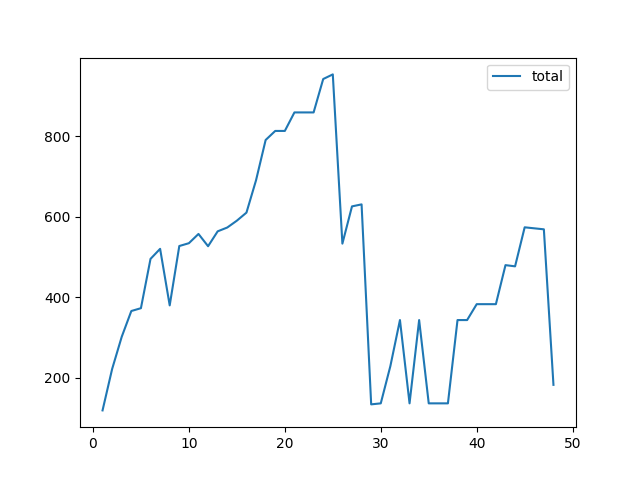
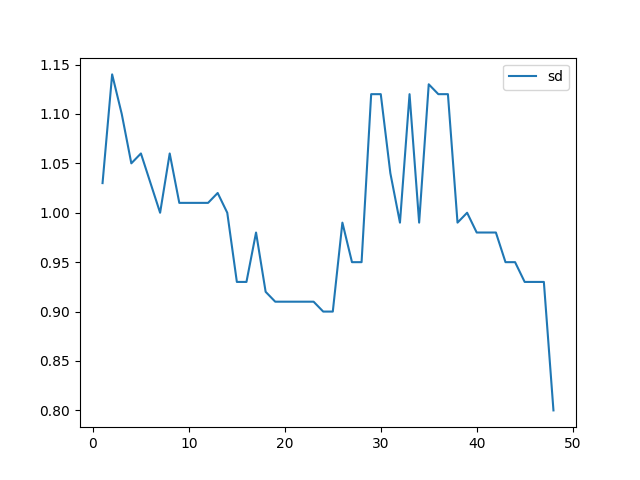
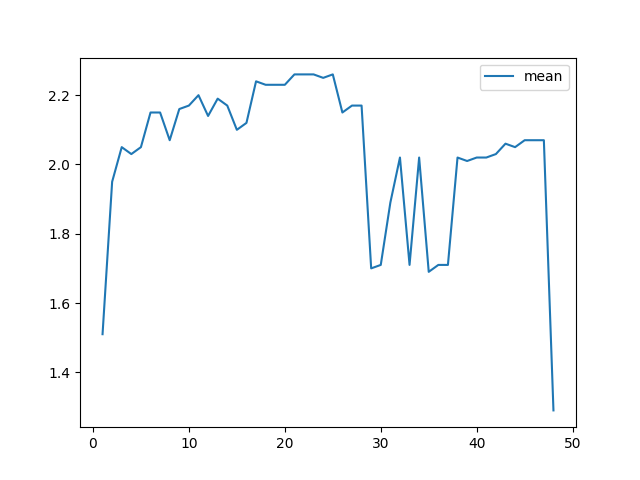
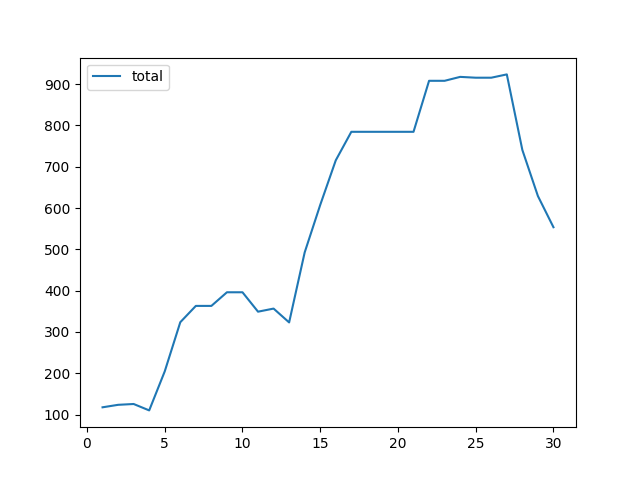
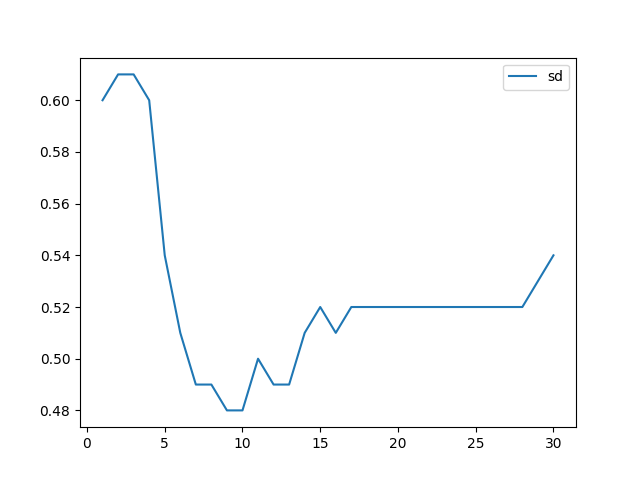
HospitalRun.tsx
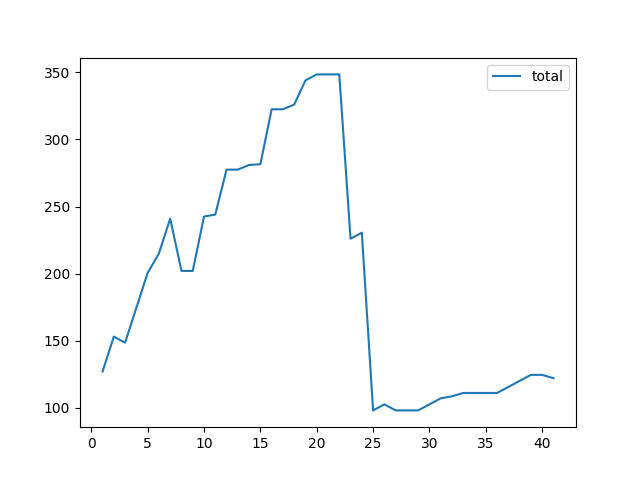
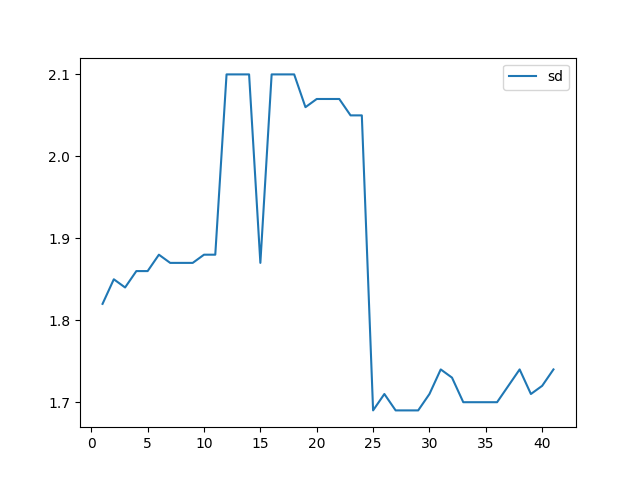
The total complexity of HospitalRun.tsx has grown strongly for a while in the past year. At some point the development team has removed much of the accumulated complexity. The mean and standard deviation curves mirror this trend.
Still, the name of the module does not reveal its intention and it does not give guidance for what should be a part of the file and what is out of scope.
HospitalRun.test.tsx
The trends of HospitalRun.test.tsx are similar to the trends of HospitalRun.tsx. It seems as if both files already have the attention of the development team.
patient-slice.ts

The patient-slice.ts file has grown in complexity during the past year. However, towards the end of the observed time period, the trend has was reversed and the complexity metric improved. The mean and standard deviation of complexity were rather steady during the entire year.
patient-slice.test.ts
Like in the other cases above, the tests trends are similar to the trends of the module under test.
Conclusions
ViewPatient.tsx and ViewPatient.test.tsx raise concerns. The growing trend of total complexity in both files suggests that the amount of code in ViewPatient.tsx is increasing. This is supported by the nearly constant shape of mean and standard deviation.
Did ViewPatient.tsx attract too many responsibilities?
Is this the reason for why the complexity in ViewPatient.test.tsx is growing?
The modules HospitalRun.tsx, HospitalRun.test.tsx, patient-slice.ts and patient-slice.test.ts have accumulated much complexity during the past year. However, at some point the development team reversed this trend. It seems as if these files have been taken care of.
Still, the name of the HospitalRun module could be improved. The current name does not tell what kind of code should be part of it. This attracts complexity, because the name does not indicate a clear separation of concerns.
Extending the Hotspot Analysis
Judge Power of Names
cp hotspots.csv hotspots-name.csv- Add a column has_good_name to the
hotspots-name.csvfile. - For each file, judge whether the file name is good and enter yes or no into the new column.
- If unsure, leave the new column blank.
Calculate Complexity
cp hotspots-names.csv hotspots-complexity.csv

# Manually insert the following column names into the beginning of the file:
# n,total,mean,sd,max,

# For each hotspot candidate cd to its repository and execute the complexity_analysis:
export MAAT_SCRIPTS=$HOME/source/learn/your-code-as-a-crime-scene/maat-scripts
cd ../frontend
python "$MAAT_SCRIPTS/miner/complexity_analysis.py" "src/patients/view/ViewPatient.tsx"

# Insert the output to the left of each corresponding line
Visualize Complexity Trends
# Find oud the first and last revision by inspecting the git log, e.g.
git log --pretty=format:'[%h] %ad %an %s' --date=short --after=2019-11-06 --before=2019-11-11 # First considered commit in 2019
git log --pretty=format:'[%h] %ad %an %s' --date=short --after=2020-11-06 --before=2020-11-08 # Last considered commit in 2020

# Then give the desired dates to the following commands
FIRST_REVISION=$(git log --pretty=format:'%h' --after=2019-11-06 --before=2019-11-11) && git log ${FIRST_REVISION}~1..${FIRST_REVISION} --
LAST_REVISION=$(git log --pretty=format:'%h' --after=2020-11-06 --before=2020-11-08) && git log ${LAST_REVISION}~1..${LAST_REVISION} --

# For every hotspot:

# Give the FULL_PATH of the file of interest - repository folder and file name are derived automatically.
FULL_PATH=frontend/src/__tests__/patients/patient-slice.test.ts \
  && SUB_PATH=${FULL_PATH/frontend\//} \
  && REPO="${FULL_PATH/\/src*/}" && cd "../$REPO"

# Get the evolution of the complexity
python "$MAAT_SCRIPTS/miner/git_complexity_trend.py" --start $FIRST_REVISION --end $LAST_REVISION --file "$SUB_PATH" > ../analysis/trend_data.csv

# Total (growth of complexity)
python "$MAAT_SCRIPTS/plot/plot.py" --column 2 --file ../analysis/trend_data.csv

# Standard deviation of complexity
python "$MAAT_SCRIPTS/plot/plot.py" --column 4 --file ../analysis/trend_data.csv

# Mean of complexity
python "$MAAT_SCRIPTS/plot/plot.py" --column 3 --file ../analysis/trend_data.csv