Table of Contents generated with DocToc
Results
When starting to look into the development cycles, I intended to focus only on
the time period before the latest release v2.0.0-alpha.7 (Nov. 7, 2020).
Later, I decided to include the present into my analysis. However, I did not extend the first section, so that the reader can follow my initial thoughts on what the development cycle should be.
Development Cycles From Start to Nov. 7, 2020
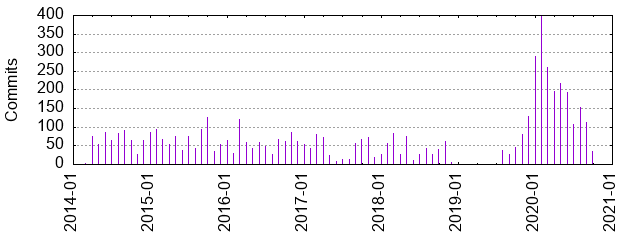
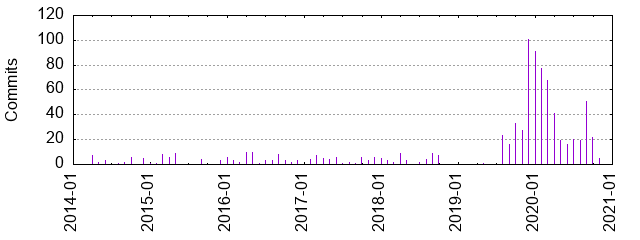
The frontend and the
server components were
started at nearly the same time in spring 2014. Until 2019 these two modules
were developed in parallel, but the number of commits over time shows that the
frontend clearly had more attention.
In November 2019 the components repository was created.
The diagrams show a yearly development cycle stretching roughly from November to November.
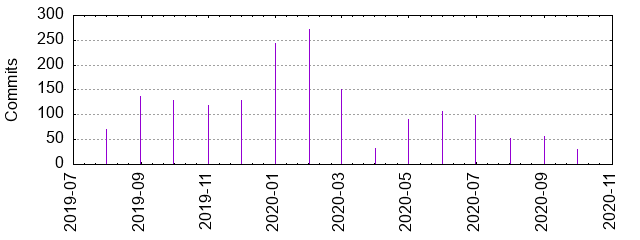
Development Activity From Nov. 2019 - Nov. 2020
The diagrams above indicate that there is a yearly rhythm of development lasting from November to November. This is emphasised in the commit history from 11/2019 to 11/2020. In this time period the overall number of commits increased a lot.
No coincidence? The changes in the development cycle happened after Maksim Sinik has become the new Maintainer of the HospitalRun project on August 7, 2019.
Basically at the same time - on August 6, 2019 - Maksim reset the frontend
project.
A branch named 1.0.0-beta was created and next, all files were deleted from
master. Matteo Vivona committed a similar change to the server
project
on August 7, 2019. I have not checked (yet) whether files or file content was
transferred from the 1.0.0-beta branches back to the new master.
As a consequence, the subsequent sections focus on the time period from 11/2019 to 11/2020:
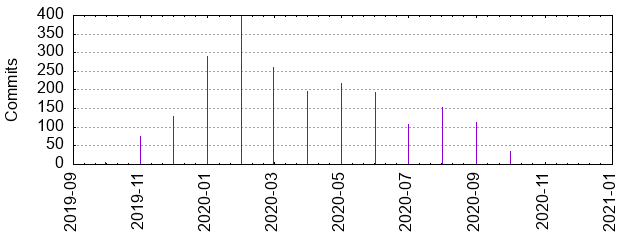
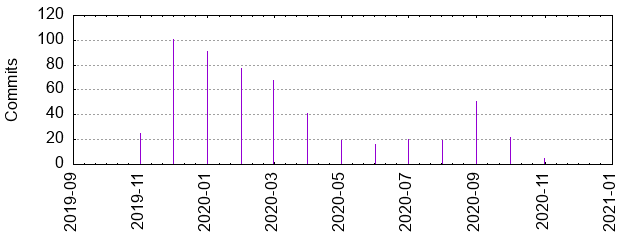
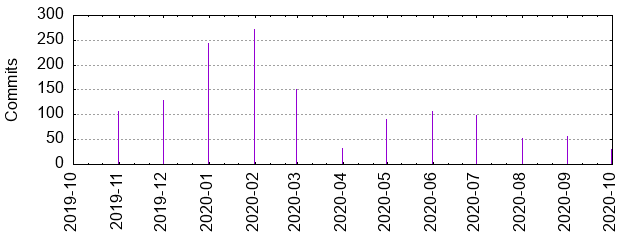
Analyzing the repositories using gitstat
shows, that the development activity reached a peak in February 2020. It slowed
down in the summer season. For the frontend, there was another period of
increased activity in September. For all components the development activity
decreased towards the date of release 2.0.0-alpha.7.
Author Activity
Frontend
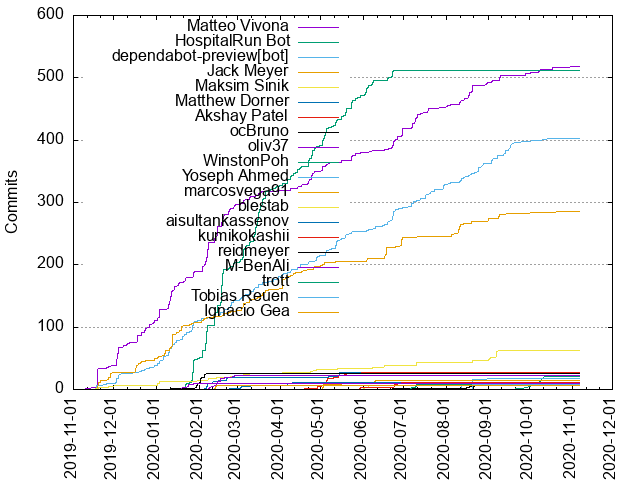
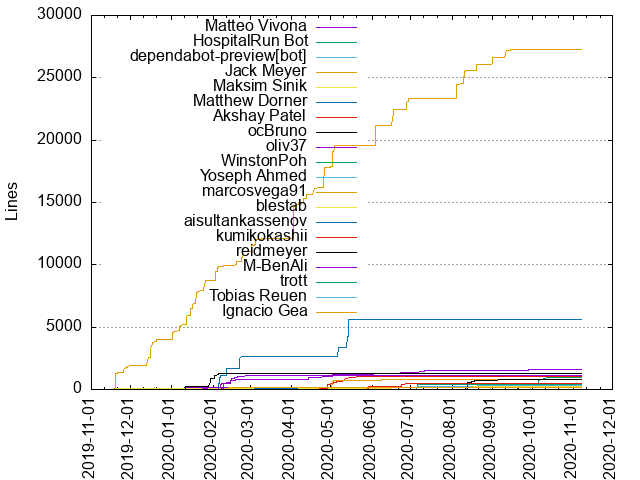
For the frontend Jack Meyer and Matteo Vivona show constant development activity
throughout the year. Jack adds significantly more lines of code than any other
author.
The following table shows the top 5 human contributors along with the bots. It is sorted by number of lines added.
| Author | Commits (%) | + lines | - lines | First commit | Last commit | Age | Active days | Rank by commits |
|---|---|---|---|---|---|---|---|---|
| Jack Meyer | 286 (13.17%) | 27270 | 13771 | 2019-10-23 | 2020-10-24 | 366 days - 23:03:56 | 115 | 4 |
| Matthew Dorner | 27 (1.24%) | 5640 | 4513 | 2020-02-06 | 2020-05-14 | 98 days - 18:10:05 | 13 | 6 |
| Matteo Vivona | 518 (23.86%) | 1631 | 1053 | 2019-11-10 | 2020-11-07 | 362 days - 19:53:06 | 150 | 1 |
| ocBruno | 25 (1.15%) | 1289 | 909 | 2020-01-12 | 2020-02-06 | 25 days - 17:13:50 | 6 | 8 |
| oliv37 | 23 (1.06%) | 1161 | 623 | 2020-02-08 | 2020-02-28 | 20 days - 3:37:14 | 12 | 9 |
| dependabot-preview[bot] | 403 (18.56%) | 264 | 264 | 2019-11-18 | 2020-10-18 | 334 days - 11:10:36 | 153 | 3 |
| Maksim Sinik | 62 (2.86%) | 148 | 133 | 2019-11-18 | 2020-09-08 | 295 days - 10:13:04 | 35 | 5 |
| HospitalRun Bot | 512 (23.58%) | 0 | 0 | 2020-01-22 | 2020-06-23 | 152 days - 21:13:14 | 98 | 2 |
The table confirms that for frontend code Jack Meyer clearly provided the most
churn. He contributed about 27.000 lines of code and deleted nearly 14.000 lines
in 286 commits.
He is followed by Matthew Dorner and Matteo Vivona. Matthew seems to contribute his share in active cycles of a few days while Matteo creates many small commits during the entire period.
Components
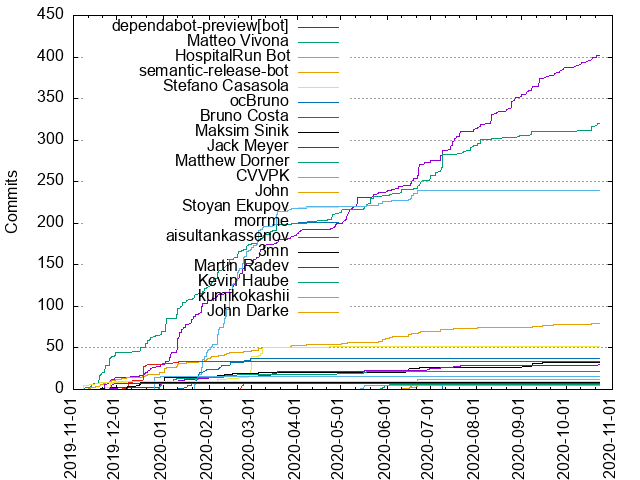
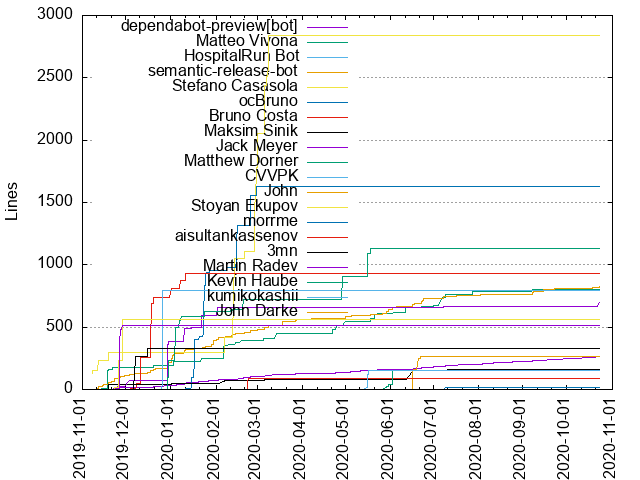
In the components module Matteo creates a steady stream of commits.
In spring 2020, Stefano Casasola has contributed most code. However, this seems to have been his only major activity throughout the development cycle. ocBruno shows similar activity and Matthew Dorner was mainly active in early summer. Other developers show a more steady behaviour.
| Author | Commits (%) | + lines | - lines | First commit | Last commit | Age | Active days | Rank by commits |
|---|---|---|---|---|---|---|---|---|
| Stefano Casasola | 52 (3.80%) | 2841 | 1299 | 2019-11-08 | 2020-04-24 | 167 days - 18:37:26 | 17 | 5 |
| ocBruno | 37 (2.70%) | 1631 | 1068 | 2020-01-11 | 2020-02-29 | 48 days - 23:44:41 | 19 | 6 |
| Matthew Dorner | 22 (1.61%) | 1128 | 357 | 2019-12-30 | 2020-05-19 | 140 days - 23:13:49 | 13 | 10 |
| Bruno Costa | 34 (2.48%) | 927 | 533 | 2019-12-05 | 2020-01-11 | 37 days - 13:57:01 | 12 | 7 |
| semantic-release-bot | 80 (5.84%) | 825 | 83 | 2019-11-11 | 2020-10-24 | 347 days - 9:12:15 | 65 | 4 |
| Matteo Vivona | 320 (23.36%) | 800 | 775 | 2019-11-08 | 2020-10-22 | 348 days - 19:34:01 | 117 | 2 |
| dependabot-preview[bot] | 402 (29.34%) | 263 | 263 | 2019-11-20 | 2020-10-22 | 336 days - 16:17:47 | 149 | 1 |
| HospitalRun Bot | 239 (17.45%) | 0 | 0 | 2020-01-22 | 2020-06-22 | 152 days - 4:05:01 | 54 | 3 |
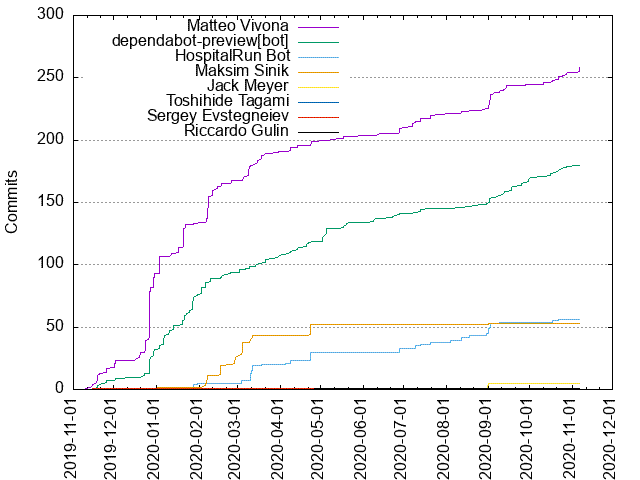
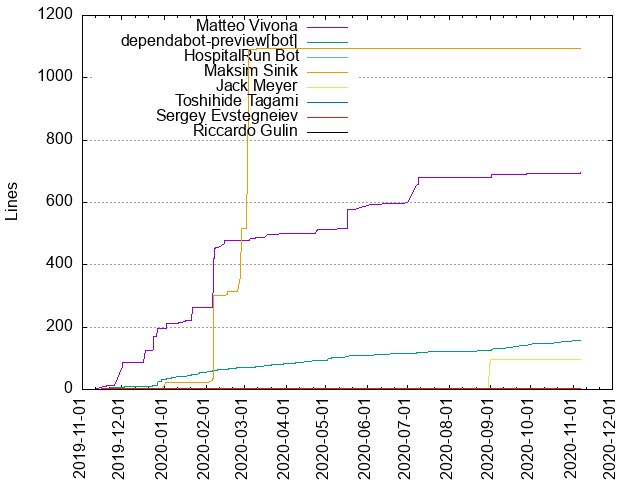
Server
| Author | Commits (%) | + lines | - lines | First commit | Last commit | Age | Active days | Rank by commits |
|---|---|---|---|---|---|---|---|---|
| Maksim Sinik | 53 (9.55%) | 1095 | 308 | 2020-01-02 | 2020-09-01 | 243 days - 6:26:09 | 14 | 4 |
| Matteo Vivona | 258 (46.49%) | 696 | 542 | 2019-11-10 | 2020-11-07 | 362 days - 19:52:07 | 76 | 1 |
| dependabot-preview[bot] | 180 (32.43%) | 156 | 156 | 2019-11-18 | 2020-11-04 | 351 days - 19:29:13 | 92 | 2 |
| Jack Meyer | 5 (0.90%) | 95 | 645 | 2020-08-30 | 2020-09-01 | 1 day - 14:10:03 | 3 | 5 |
| HospitalRun Bot | 56 (10.09%) | 0 | 0 | 2020-01-27 | 2020-10-22 | 268 days - 15:27:53 | 23 | 3 |
For the server component only Maksim, Matteo and Jack provided significant
contributions in 2019. However, the overall evolution of this component is
rather slow when compared to frontend and components. This is also reflected
in the earlier post on Hotspot
Analysis.
Conclusion
Compared to the earlier years of the project, the development activity was
increased from 11/2019 to 11/2020. In general, the frontend gets most
attention, followed by the components module.
Main contributors from 11/2019 to 11/2020 were
- Jack Meyer (frontend)
- Matthew Dorner (frontend, components)
- Matteo Vivona (frontend, components, server)
- ocBruno (frontend, components)
- Maksim Sinik (frontend)
- Stefano Casasola (components)
- Bruno Costa (components)
- Maksim Sinik (server)
- Jack Meyer (server)
If any contributor feels that I have overlooked her or him, please contact me. I took the numbers from GitHub for the evaluation above. I assume there might be mistakes in my evaluation.
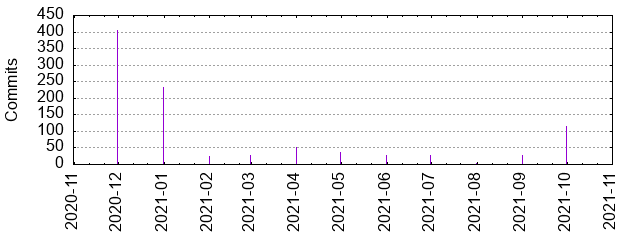
Development Activity From Nov. 2020 - Nov. 2021
From the development cycle I would have assumed that there was a release in November 2020. Because there are no associated tags on the repository, I was afraid that the project received less attention in 2020.
Note: As of March 25, 2022, the last commit to the components repository was made on October 22, 2021.
Author Activity
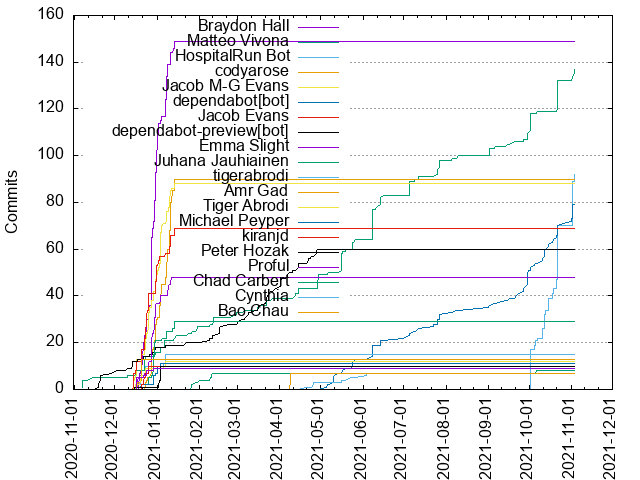
Frontend
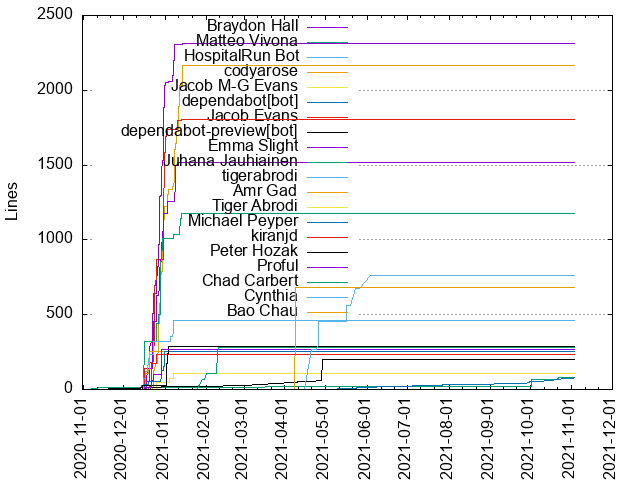
| Author | Commits (%) | + lines | - lines | First commit | Last commit | Age | Active days | Rank by commits |
|---|---|---|---|---|---|---|---|---|
| Braydon Hall | 149 (14.65%) | 2310 | 3002 | 2020-12-16 | 2021-01-14 | 28 days - 9:31:58 | 24 | 1 |
| codyarose | 90 (8.85%) | 2163 | 2858 | 2020-12-23 | 2021-01-14 | 22 days - 1:51:34 | 18 | 4 |
| Jacob Evans | 69 (6.78%) | 1804 | 2842 | 2020-12-15 | 2021-01-14 | 30 days - 3:42:27 | 15 | 7 |
| Emma Slight | 48 (4.72%) | 1517 | 1669 | 2020-12-18 | 2021-01-11 | 23 days - 21:11:38 | 13 | 9 |
| Juhana Jauhiainen | 29 (2.85%) | 1176 | 869 | 2020-12-16 | 2021-01-13 | 28 days - 1:17:00 | 10 | 10 |
| Jacob M-G Evans | 88 (8.65%) | 108 | 77 | 2020-12-15 | 2021-01-14 | 30 days - 3:32:42 | 21 | 5 |
| Matteo Vivona | 137 (13.47%) | 79 | 50 | 2020-11-07 | 2021-11-03 | 361 days - 0:56:52 | 54 | 2 |
| HospitalRun Bot | 92 (9.05%) | 0 | 0 | 2021-10-02 | 2021-11-03 | 32 days - 0:00:15 | 14 | 3 |
Until June 3, the frontend had some attention of individual developers working on individual features. However, I cannot see significant collaboration from the git logs. The changes look unrelated and the last change to business logic was made on June 3, 2021. From then on, only dependencies and automerge related code was changed.
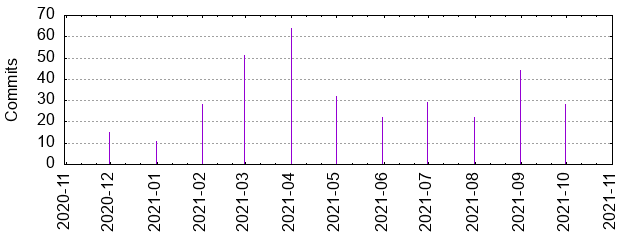
Components
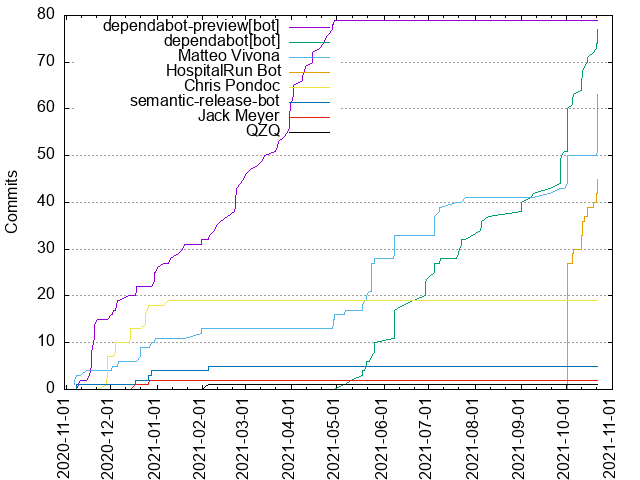
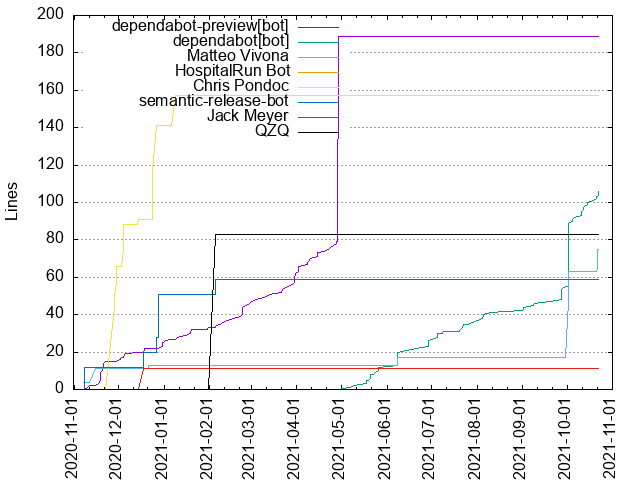
| Author | Commits (%) | + lines | - lines | First commit | Last commit | Age | Active days | Rank by commits |
|---|---|---|---|---|---|---|---|---|
| dependabot-preview[bot] | 79 (27.15%) | 189 | 79 | 2020-11-10 | 2021-04-29 | 170 days 4:45:33 | 53 | 1 |
| Chris Pondoc | 19 (6.53%) | 157 | 105 | 2020-11-28 | 2021-01-09 | 41 days - 9:50:50 | 8 | 5 |
| dependabot[bot] | 77 (26.46%) | 106 | 106 | 2021-05-06 | 2021-10-22 | 168 days - 22:21:31 | 39 | 2 |
| QZQ | 1 (0.34%) | 83 | 31 | 2021-02-04 | 2021-02-04 | 0:00:00 | 1 | 8 |
| Matteo Vivona | 63 (21.65%) | 75 | 71 | 2020-11-07 | 2021-10-22 | 348 days - 22:07:20 | 28 | 3 |
| semantic-release-bot | 5 (1.72%) | 59 | 5 | 2020-11-08 | 2021-02-04 | 88 days - 8:47:46 | 5 | 6 |
| Jack Meyer | 2 (0.69%) | 11 | 1 | 2020-12-18 | 2020-12-27 | 9 days - 16:11:33 | 2 | 7 |
| HospitalRun Bot | 45 (15.46%) | 0 | 0 | 2021-10-02 | 2021-10-22 | 19 days - 21:39:15 | 10 | 4 |
The last change to business logic was made on Feb. 5, 2021. From then on, only dependencies and automerge related code was changed.
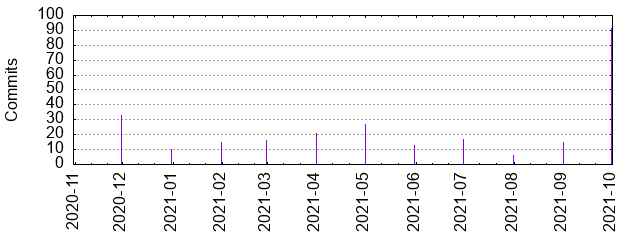
Server
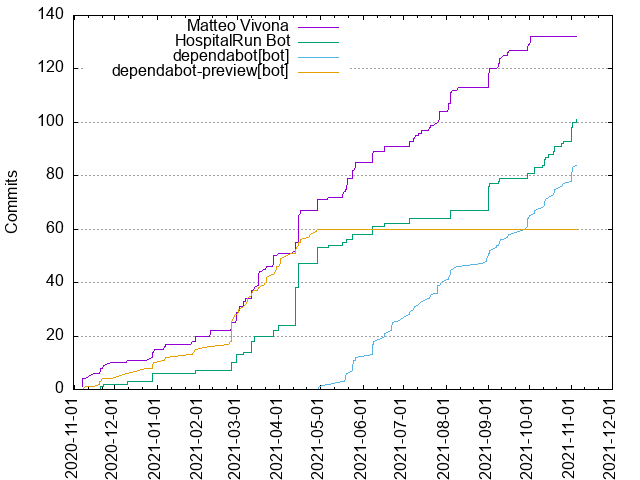
| Author | Commits (%) | + lines | - lines | First commit | Last commit | Age | Active days | Rank by commits |
|---|---|---|---|---|---|---|---|---|
| dependabot-preview[bot] | 60 (15.92%) | 116 | 59 | 2020-11-10 | 2021-04-28 | 169 days - 17:41:34 | 43 | 4 |
| dependabot[bot] | 84 (22.28%) | 84 | 84 | 2021-04-30 | 2021-11-05 | 188 days - 22:36:03 | 59 | 3 |
| Matteo Vivona | 132 (35.01%) | 49 | 24 | 2020-11-07 | 2021-10-02 | 329 days - 1:05:50 | 66 | 1 |
| HospitalRun Bot | 101 (26.79%) | 0 | 0 | 2020-11-20 | 2021-11-05 | 349 days - 12:10:21 | 41 | 2 |
Starting on Nov. 19, 2020, the only changes were related to automatically upgrading dependencies.
From Nov. 2021 to Mar. 2022: No Significant Activity
Looking at the time period from Nov. 2021 to Mar. 29, 2022, there is no significant further development visible. Considering that winter and spring were the most active seasons in earlier development cycles, it feels like the project has fallen asleep.
For the frontend the only business logic change after Nov. 7, 2021 was a merge
commit of work that had been finished in September 2021.
All commits in the server module are related to maintenance. There was no
further development.
Most concern is raised by the fact, there was no commit in the components
repository. This means that the dependencies are not kept up-to-date.
Identifying Development Cycles and Author Contributions
Prerequisites
# Prerequisite: Get gitstats (requires gnuplot and python)
brew install gnuplot

# Clone gitstats and export its path to an environment variable
git clone https://github.com/gktrk/gitstats.git
export GITSTATS=$HOME/source/gktrk/gitstats
Collecting the Data
# Identify the development cycles for the different modules
for MODULE in frontend server components; do \
  rm -vr "analysis/${MODULE}-gitstats"; \
  cd "$MODULE" || break; \
  python "$GITSTATS/gitstats" ./ "../analysis/${MODULE}-gitstats"; \
  cd ".."
done

# Open the analysis in a browser
open ../analysis/frontend-gitstats/index.html
Selecting the Development Cycle Visualization
In the top section I am showing the Analysis → Commits by Year / Month diagram for each component.
Focussing on a Development Cycle
If you would like to select a specific start date for the analysis, then pass
the -c start-date parameter to gitstats:
MODULE=FRONTEND \
python "$GITSTATS/gitstats" -c start_date=2019-11-07  ./ "../analysis/${MODULE}-gitstats"
This allows focussing on the time range defined by the start date and the date of the current working directory commit.
In order to find an appropriate end date, you can search the git history, by a desired month:
YEAR=2021; \
MONTH=11; \
TIMEZONE=+0100; \
AFTER_DATE=$(date -j -v-1d -f "%4Y-%m-%d %H:%M:%S %z" +%Y-%m-%d "${YEAR}-${MONTH}-01 00:00:00 ${TIMEZONE}"); \
BEFORE_DATE=$(date -j -f "%4Y-%m-%d %H:%M:%S %z" +%Y-%m-%d "${YEAR}-$((MONTH+1))-01 00:00:00 ${TIMEZONE}"); \
git log --pretty=format:'[%h] %ad %s' --date=short --after=$AFTER_DATE --before=$BEFORE_DATE
Then you can checkout to the identified commit hash.
Selecting the Author Contribution Visualisation
In order to show when the main authors work and how frequently they commit, I have selected the Authors → Commits by Author diagram for each component.
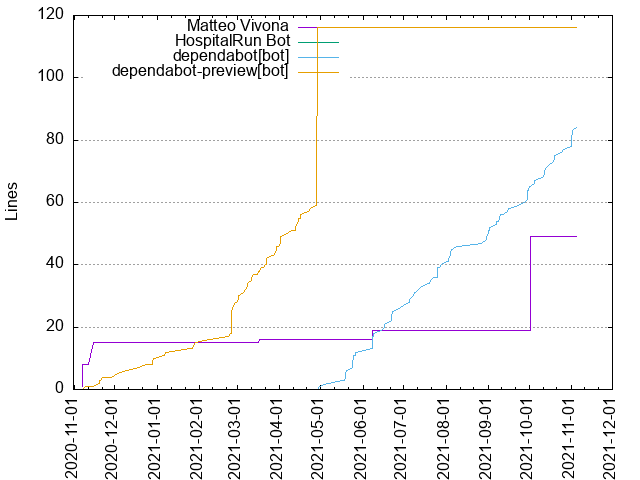
The Authors → Cumulated Added Lines of Code per Author diagrams visualize the amount of effort each main author spends.
Note that the diagrams usually have a transparent background. To remove transparency and have a white background I use the following command from imagemagick:
mogrify -background white -alpha remove -alpha off PNGFILE.png
The thumbnails are generated by
mogrify -format png -auto-orient -thumbnail 320x -path thumbnails '2019-2020-*by_author.png'
Generating the Author Contribution Table
The table of author contributions shown above has been generated as follows:
- Sort the table by
+ lines - Copy paste the HTML table Authors → List of Authors into a file
- Replace all occurrences of the regex
,\sby ` - `. This will remove the commas from the field Age - Remove all
\s*↓occurrences - Replace all
\ttab characters by,comma - Save the file as
authors.csv, if the file covers the entire analysis period orauthors-2019.csv, if it covers only one development cycle
If you’d like to generate an HTML table from the file using the Liquid Template Language, then the following steps will help:
- Remove the ` (%)
suffix in theCommits (%)` column header - Replace the
#character by the wordRank - Make all column headers lower case, remove special characters (replace
+byaddedand-byremoved) - Change the column headers to single words by replacing spaces with underscores
- Convert the csv file to json, which was required for this HTML visualization using
csv2json -o authors.json authors.csv
Note:
If you like, then shorten the csv file. In the analysis shown above, I have
sorted the file by number of lines added and kept the top five contributors.
In addition I ensured that the top 5 committers stay in the file (as indicated
by the rank by commits). Accordingly I have renamed the file to
frontend-authors.csv