Applied Software Forensics - HospitalRun Architecture Safety Net
23 May 2022
Table of Contents generated with DocToc
- Results
- Analyze Coupling on an Architectural Level
- Configuration
- Analyze Level 1: Coupling on System Level
- Analyze Level 2: Coupling in the Frontend
- Analyze Coupling of Frontend Code and Tests
- Analyze Trend of Frontend and Test Growth
- Analyze the Trend of Frontend and Tests Coupling
- Get a Detailed View of Coupling Between Frontend Modules and Associated Tests
Results
Level 1: Coupling on System Level
For the time period of Nov. 2019 to Nov. 2020 Code Maat does not report any temporal coupling across the repositories frontend, server and components.
Level 2: Coupling in the Frontend
The remaining analyses focus on the frontend, because it is the largest subsystem and it shows the most active
development.
Advice: Separate Inter-Module Coupling Analysis from Module-Test Coupling Analysis
My first analysis of top level module coupling included the __tests__ folder. Code Maat showed only one entry: The
degree of coupling between patients and __tests__ is 51 %.
This is expected, because in a project with solid tests, a feature file will always be coupled to the assoicated test to some degree. Whether the value of 51 % is good, can be debated.
However, the absence of other coupling entries puzzled me first. I was expecting to see coupling between the top level
frontend modules as well. So, I suspected that the module-test coupling overshadowed inter-module coupling. To avoid
this confusion, I decided to analyze inter-module coupling separately from module-test coupling.
Coupling of Top Level Frontend Modules
Code Maat does not report significant coupling among the top level modules of the frontend.
In order to see whether I configured Code Maat correctly, I reduced the minimum coupling considered by Code Maat to 10 %. Now some modules with a small amount of coupling are listed. Numbers below 30 % are ok for a healthy code base.
| entity | coupled | degree | average-revs |
|---|---|---|---|
| shared | user | 18 | 43 |
| labs | scheduling | 18 | 43 |
| patients | scheduling | 17 | 118 |
| labs | shared | 16 | 48 |
| incidents | labs | 16 | 36 |
| incidents | shared | 15 | 51 |
| patients | shared | 13 | 123 |
| imagings | shared | 13 | 37 |
Coupling of Frontend Code and Tests
For the entire period from November 2019 to November 2020 the overall coupling of code and tests was 37 %. Of the 2204 commits in the git history file, 633 referred to a module file and a test file at the same time. According to Section “Differentiate Between the Level of Tests” in Your Code as a Crime Scene (pp. 94), this is a healthy value.
Trend of Frontend and Test Growth
The following diagram compares the number of frontend application code changes to the number of changes made to the
tests:
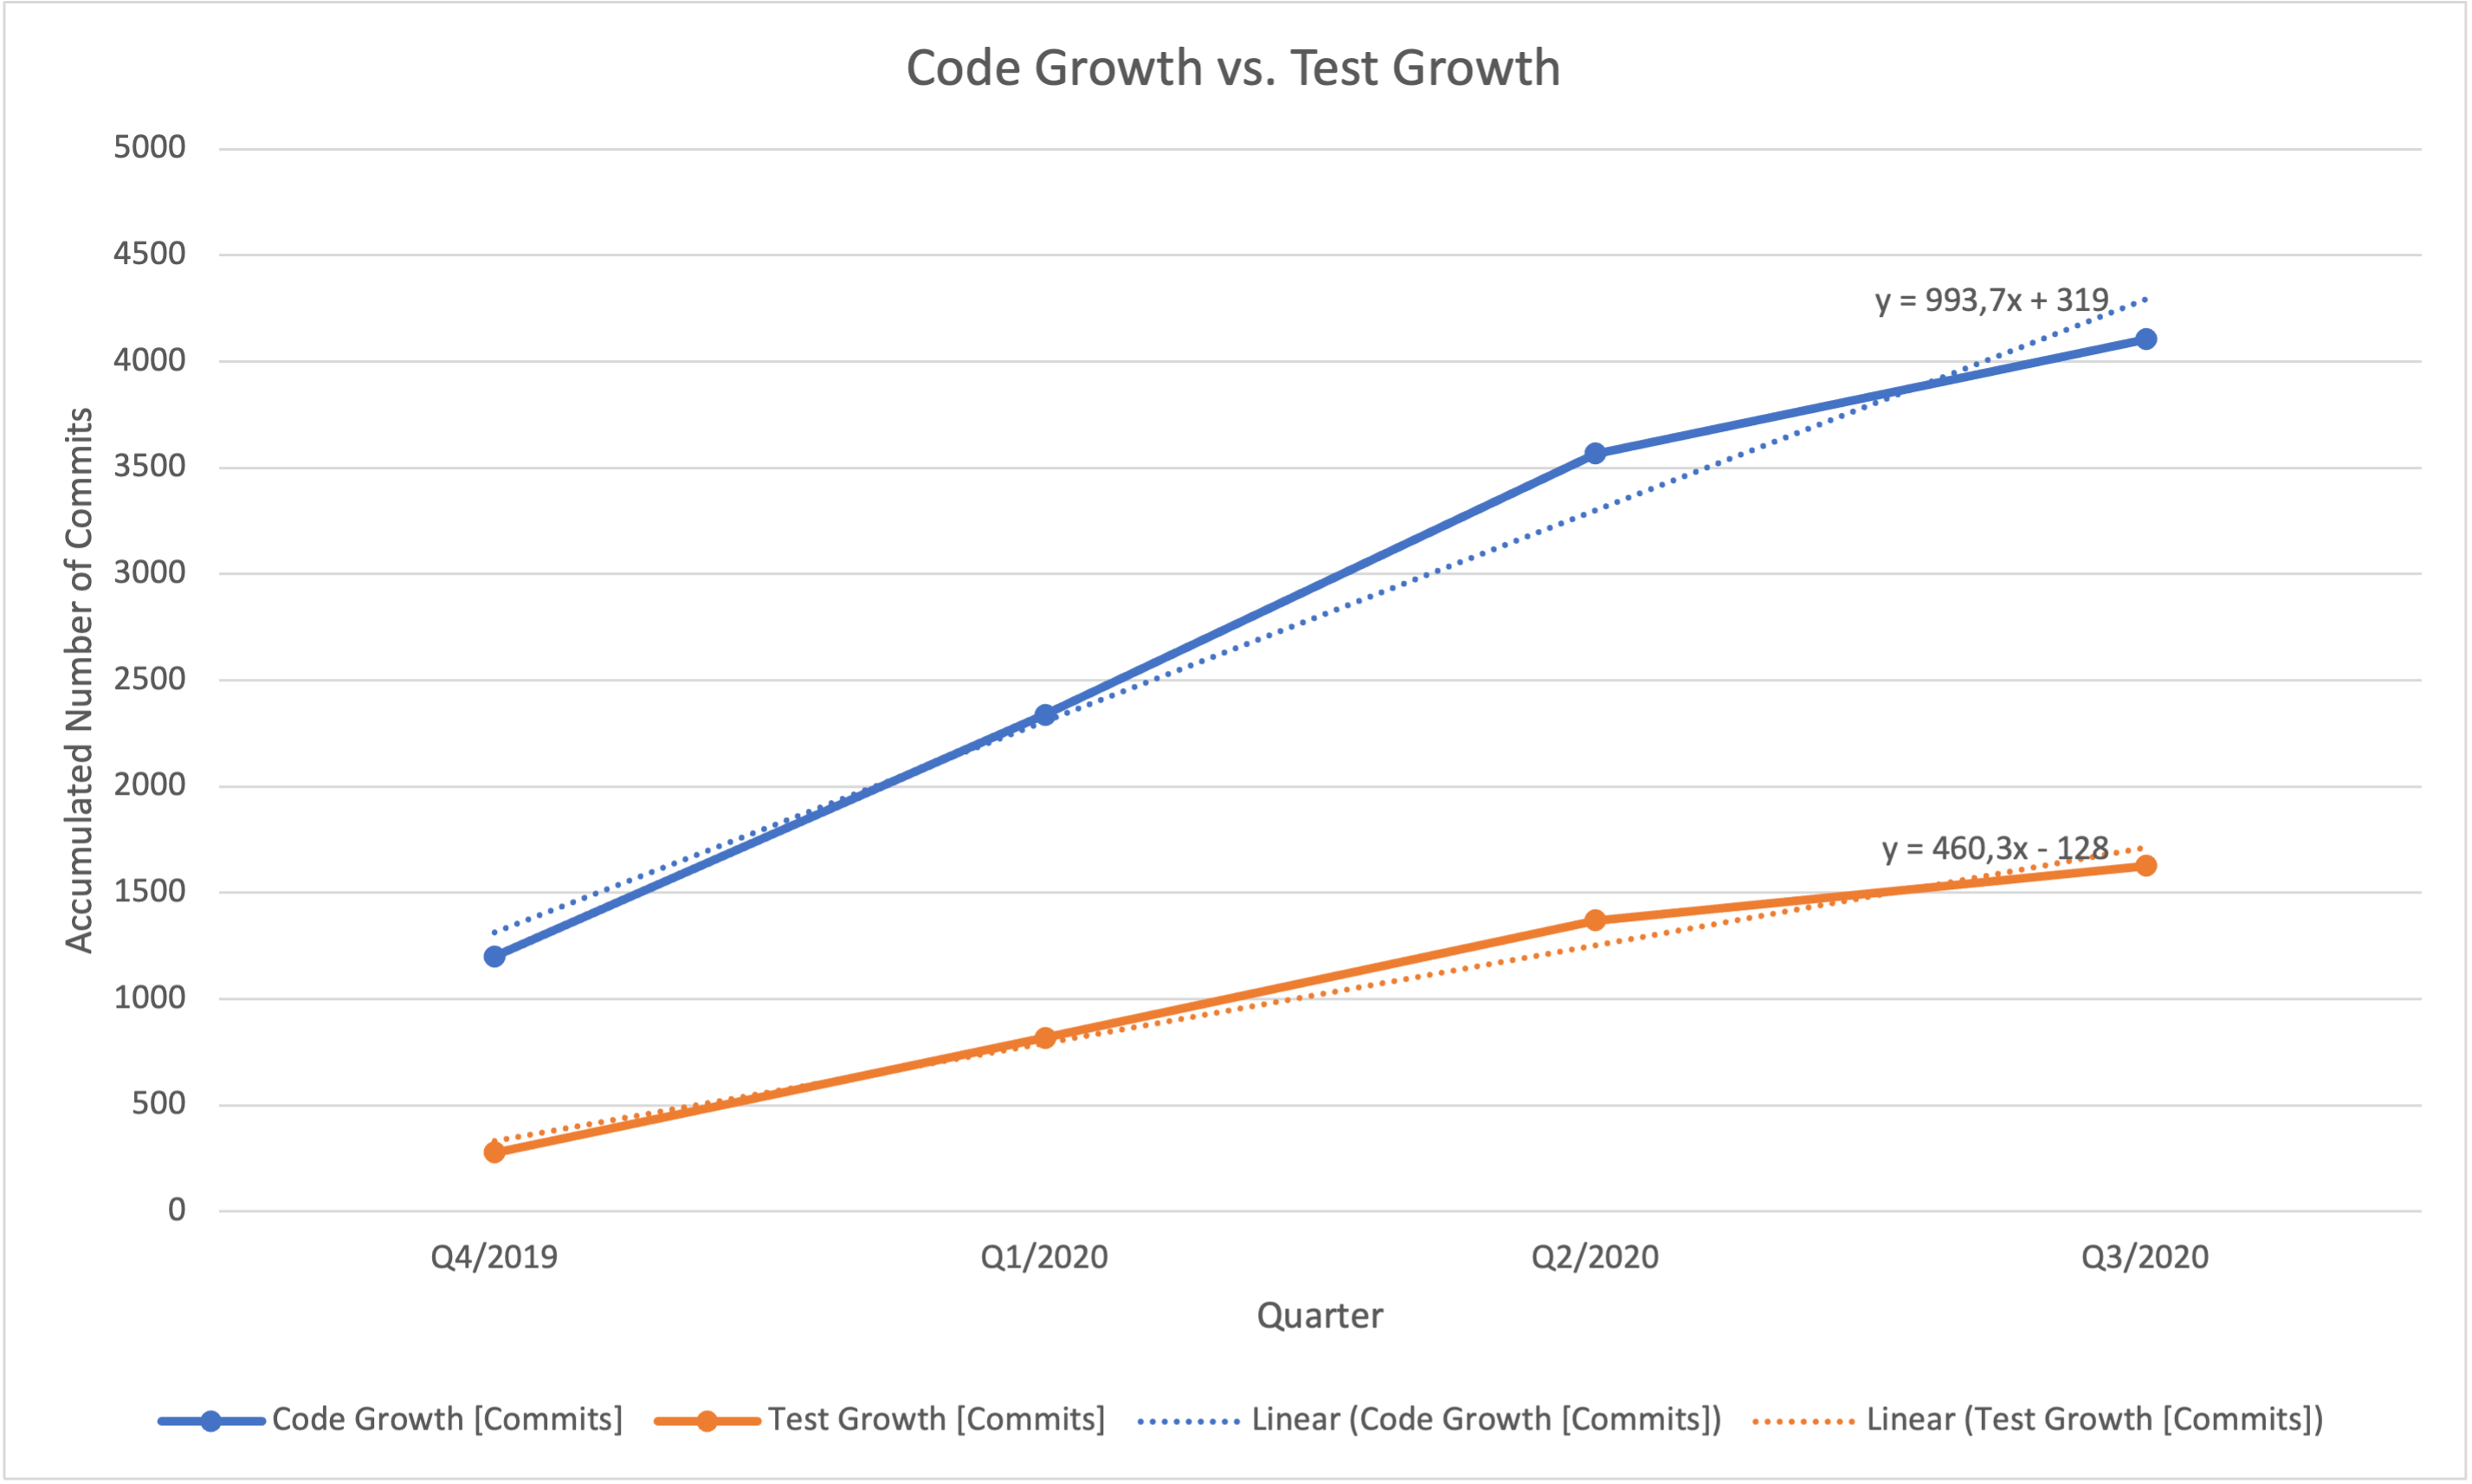
The plot shows a rather constant ratio of 2 code commits : 1 test commit. This indicates that the tests are stable.
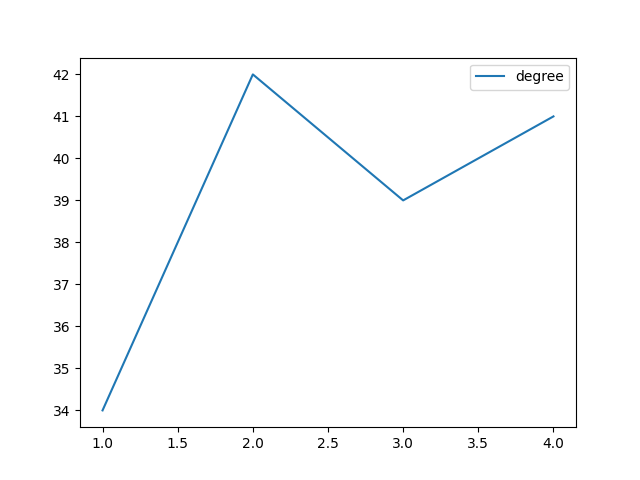
Trend of Frontend and Test Coupling
Inspecting how the coupling between frontend and test code evolved on a quarterly basis shows that it stays basically constant. This goes in line with the trend of effort analysis above.
In the following “Trend of Coupling of Frontend Code and Tests” diagram, the quarter is shown on the horizontal axis while the percent of coupling is shown on the vertical axis.
Detailed View of Coupling Between Frontend Modules and Associated Tests
When the __tests__ and __mocks__ folders are included in the top level analysis, then a quite strong value of 51%
is shown for __tests__ and the patients module. Other significant coupling is not shown.
Digging deeper shows that several top level frontend modules are coupled to their associated tests:
| entity | coupled | degree | average-revs |
|---|---|---|---|
| imagings | imagings tests | 88 | 9 |
| patients | patients tests | 69 | 171 |
| scheduling | scheduling tests | 61 | 52 |
| labs | labs tests | 49 | 27 |
| incidents | incidents tests | 40 | 30 |
The average-revs column shows the highest development activity for the patients module. This explains why the
previous higher level coupling analysis showed only coupling between patients and __tests__.
In general, the table above looks ok to me. It shows the modules with development activity and it shows, that tests are maintained for those modules.
As I do not know the code base well enough, I cannot judge whether coupling values above 50 % indicate too tight coupling or just a “test first” coding style.
Analyze Coupling on an Architectural Level
Configuration
export MAAT_SCRIPTS=$HOME/source/learn/your-code-as-a-crime-scene/maat-scripts; \
cd $HOME/source/hospitalrun/analysis
Analyze Level 1: Coupling on System Level
Capture the system level design in hospitalrun_boundaries.txt:
# Specify architectural boundaries on top level
cat << EOF > hospitalrun_boundaries.txt
frontend => frontend
components => components
server => server
EOF

# Analyse coupling
# (note: the all_evo.log contains the development from Nov. 2019 - Nov. 2020)
docker run -v "$PWD":/data -it code-maat-app -l /data/all_evo.log -c git -a coupling -g /data/hospitalrun_boundaries.txt
For me, the output is empty. There is no significant coupling on the top level :-)
Even reducing the minimum coupling considered by Code Maat to 0 does not show any coupling (use the parameter
--min-coupling 0):
docker run -v "$PWD":/data -it code-maat-app -l /data/all_evo.log -c git -a coupling --min-coupling 0 -g /data/hospitalrun_boundaries.txt
Analyze Level 2: Coupling in the Frontend
Analyze Coupling of Top Level Frontend Modules
The following statement produces the frontend_boundaries.txt file containing only the modules on the top level of
frontend. For the moment, the __tests__ and __mocks__ directories are ignored.
# Run the following command from the "analysis" folder
#
# Create a boundaries file from all module folders within a directory.
#
# Algorithm:
#   Find all directories below ../frontend/src
#     skip the directories ../frontend/src, ../frontend/src/__tests__ and ../frontend/src/__mocks__
#     let \1 be the parent directory of the module
#     let \2 be the module directory
#     remove leading '../frontend/'
#     print \1\2 => \2
find ../frontend/src -type d -maxdepth 1 \
  | grep -E --invert-match '(^.*\/src$)|(__)' \
  | sed 's/^\.\.\/frontend\/\(.*\/\)\(.*\)/\1\2 => \2/' \
  > frontend_boundaries.txt

# Analyse coupling
# (note: the frontend_evo.log contains the development from Nov. 2019 - Nov. 2020)
docker run -v "$PWD":/data -it code-maat-app -l /data/frontend_evo.log -c git -a coupling -g /data/frontend_boundaries.txt
Again, there is no significant coupling.
This time, reducing the minimum coupling considered by Code Maat, shows that there is a bit of coupling between some
modules (note that output is redirected to the file frontend_coupling.csv):
docker run -v "$PWD":/data -it code-maat-app -l /data/frontend_evo.log -c git -a coupling --min-coupling 10 -g /data/frontend_boundaries.txt > frontend_coupling.csv
Check the output file frontend_coupling.csv to see:
entity,coupled,degree,average-revs
shared,user,18,43
labs,scheduling,18,43
patients,scheduling,17,118
labs,shared,16,48
incidents,labs,16,36
incidents,shared,15,51
patients,shared,13,123
imagings,shared,13,37
The table in section Results above is based on the json version of the csv file:
csv2json -o frontend_coupling.json frontend_coupling.csv
Analyze Coupling of Frontend Code and Tests
To find out how strong the coupling between the code and the tests is, create the following
frontend_code_test_boundaries.txt:
cat << EOF > frontend_code_test_boundaries.txt
^((?!__tests__)(?!__mocks__).)*$ => Code
^(.*__tests__.*)|(.*__mocks__.*)$ => Tests
EOF

# Analyse coupling
# (note: the all_evo.log contains the development from Nov. 2019 - Nov. 2020)
docker run -v "$PWD":/data -it code-maat-app -l /data/frontend_evo.log -c git -a coupling -g /data/frontend_code_test_boundaries.txt
For Nov. 2019 - Nov. 2020 the overall coupling of code and test was
entity,coupled,degree,average-revs
Code,Tests,37,633
Analyze Trend of Frontend and Test Growth
Use the git history files created in the Trend of Coupling Analysis to analyze the number of commits to the code and to the tests per development quarter:
for EVO_FILE in frontend_evo_201911P3M.log frontend_evo_202002P3M.log frontend_evo_202005P3M.log frontend_evo_202008P3M.log; do
  docker run -v "$PWD":/data -it code-maat-app -l "/data/$EVO_FILE" -c git -a revisions -g /data/frontend_code_test_boundaries.txt; \
done
Output:
entity,n-revs
Code,1202
Tests,277
entity,n-revs
Code,1137
Tests,540
entity,n-revs
Code,1228
Tests,553
entity,n-revs
Code,538
Tests,257
Transform these values to a csv table in frontend_code_test_growth.csv:
Date, Delta Code Growth [Commits], Delta Test Growth [Commits]
Q4/2019, 1202, 277
Q1/2020, 1137, 540
Q2/2020, 1228, 553
Q3/2020, 538, 257
This time the plot was created using a spreadsheet application. First two columns were added to sum up the incremental values. Then these columns were plotted.
Analyze the Trend of Frontend and Tests Coupling
Analyze the trend of coupling in quarterly intervals:
for EVO_FILE in frontend_evo_201911P3M.log frontend_evo_202002P3M.log frontend_evo_202005P3M.log frontend_evo_202008P3M.log; do
  docker run -v "$PWD":/data -it code-maat-app -l "/data/$EVO_FILE" -c git -a coupling -g /data/frontend_code_test_boundaries.txt; \
done
Output:
entity,coupled,degree,average-revs
Code,Tests,34,266
entity,coupled,degree,average-revs
Code,Tests,42,249
entity,coupled,degree,average-revs
Code,Tests,39,200
entity,coupled,degree,average-revs
Code,Tests,41,130
For the section Results, the output was converted to a csv file frontend_code_test_coupling_trend.csv and
a plot was created using the plot tool from
maat-scripts:
frontend_code_test_coupling_trend.csv:
entity,coupled,degree,average-revs
Code,Tests,34,266
Code,Tests,42,249
Code,Tests,39,200
Code,Tests,41,130
python "$MAAT_SCRIPTS/plot/plot.py" --column 3 --file "frontend_code_test_coupling_trend.csv"
Get a Detailed View of Coupling Between Frontend Modules and Associated Tests
To dig deeper into module-test coupling, map the tests for each module to the module itself:
# Print modules and __mocks__
find ../frontend/src -type d -maxdepth 1 \
  | grep -E --invert-match '(^.*\/src$)|(^.*\/src/__tests__$)' \
  | sed 's/^\.\.\/frontend\/\(.*\/\)\(.*\)/\1\2 => \2/' \
  > frontend_modules_tests_boundaries.txt; \
\
# Add directories below src/__tests__
find ../frontend/src/__tests__ -type d -maxdepth 1 \
  | grep -E --invert-match '^.*\/src/__tests__$' \
  | sed 's/^\.\.\/frontend\/\(.*\/\)\(.*\)/\1\2 => \2 tests/' \
  >> frontend_modules_tests_boundaries.txt

docker run -v "$PWD":/data -it code-maat-app -l /data/frontend_evo.log -c git -a coupling -g /data/frontend_modules_tests_boundaries.txt > frontend_modules_tests_coupling.csv
This shows the coupling between a module and the associated tests more precisely:
entity,coupled,degree,average-revs
imagings,imagings tests,88,9
patients,patients tests,69,171
scheduling,scheduling tests,61,52
labs,labs tests,49,27
incidents,incidents tests,40,30
The associated json file for this website is created with
csv2json -o frontend_modules_tests_coupling.json frontend_modules_tests_coupling.csv